Container fleet hits a record 34m TEU. Where did the spare capacity go?
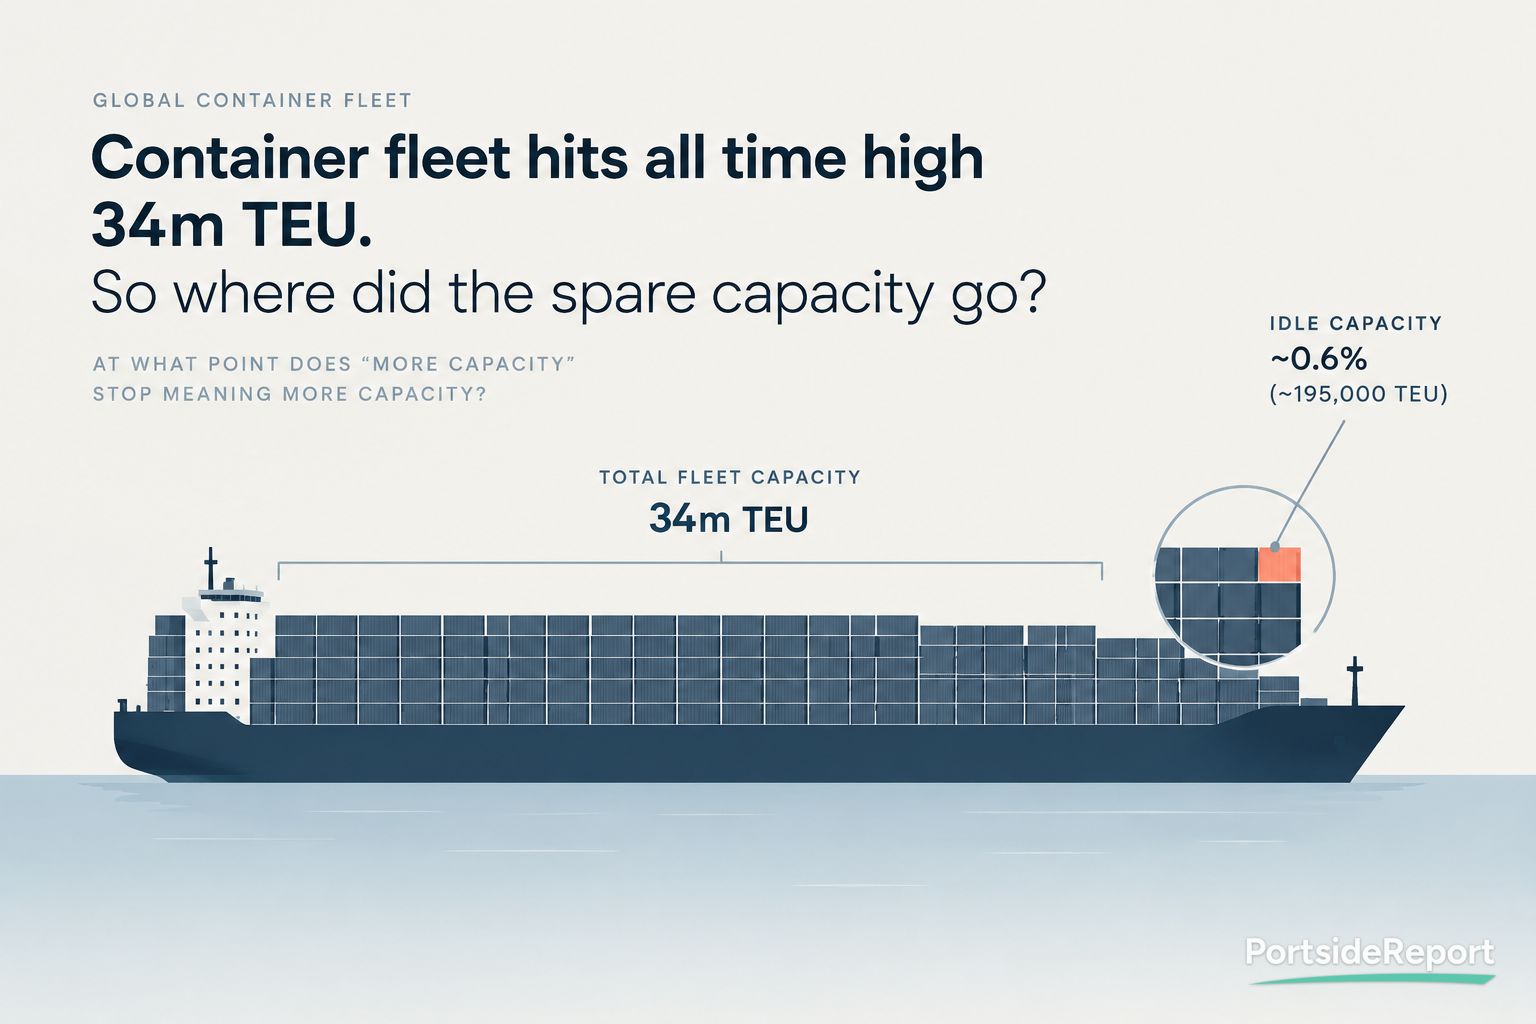
At what point does “more capacity” stop meaning more capacity?
Record capacity arrives in a month when almost none of it is spare, and that gap is where allocation, berth windows and forecast logic quietly come apart.
The container fleet is expanding rapidly, but congestion, diversions and longer round trips are absorbing much of the additional capacity before it becomes visible as idle tonnage. The result is a growing gap between nominal fleet capacity and the capacity the network can actually deliver.
The announcement
BIMCO said in early September that global container fleet capacity is about to cross 34 million TEU. At the start of the month the fleet sat 8,000 TEU short of the mark, with 46 ships totalling 286,000 TEU scheduled for delivery during September. The fleet has added 10 million TEU since early 2021, a 42% increase in five and a half years; the previous 10 million TEU took more than ten and a half. Less than 300,000 TEU was recycled over the same period. Chief Shipping Analyst Niels Rasmussen put more than 14 million TEU in the orderbook through 2030, which would take the fleet toward 44 million TEU: "Even if every ship currently aged 20 years or more is recycled by then, supply growth will remain high."
What it means
Alphaliner's early-September count had 67 ships and roughly 195,000 TEU commercially idle, about 0.6% of the cellular fleet. Sea-Intelligence put July global schedule reliability at 56.4%, down 6.1 points month on month, the worst reading of 2026 and the sharpest single-month fall since January 2021, with average delay for late arrivals at 6.06 days. Maersk led at 73.7%, Hapag-Lloyd at 69.3%, and nobody else cleared 70%.
Read those three numbers together and the record loses its usual meaning. The tonnage is on the water and it is working. It is absorbed by queues, diversions and longer round-trip times rather than parked at anchor waiting for demand.
The composition matters more than the total. Ships above 12,000 TEU delivered around two thirds of the 10 million TEU added, lifting their share of total capacity from 30% to 40%. Average ship size is up 14%. That does not translate into 42% more port calls. It is broadly the same call count with much larger exchanges per call, more crane intensity, and berth occupancy that runs past windows negotiated on 2021 call sizes. If your terminal agreements still describe a window in hours rather than in moves, that is the contract quietly failing.
August showed what this does under stress. Typhoon Dolphin suspended operations at Shanghai and Ningbo on 7 and 8 August, with closures running into the 9th. Berth waits at Yangshan exceeded 12 days at the peak, Waigaoqiao averaged around eight, and roughly 2.4 million TEU of capacity was reported stranded across North Asia after the storm.
Bigger ships bunch harder and recover slower. When a 20,000 TEU vessel misses its slot, the catch-up is not a day of extra speed, it is a rotation change, a port omission, or a cascading string.
This is where the planning tooling gets exposed. Every allocation and booking system I have worked on carries capacity as a nominal figure attached to a proforma string. Effective capacity is what survives the actual round trip after waiting time, omissions and phase-in slippage. When reliability drops six points in a month, the extra ships being phased in are funding schedule integrity, not carrying incremental cargo. The commercial side still sees the nominal allocation, prices against it, and then cannot convert it. That mismatch reads as poor forecasting on the booking desk when it is really a definitional gap in the model. Most allocation systems still treat capacity as a single nominal figure attached to a proforma string rather than distinguishing effective capacity after real-world delays.
The chokepoints make the same point with money. SK Gas paid a record $5.3 million on 1 September for a northbound Panama Canal slot for the LPG carrier G. Spirit, against a pre-February median around $55,000, while daily transits had been cut to 32–34 and Neopanamax slots held at nine.
. Fleet capacity does nothing for you at a waterway with a fixed slot count. Some carriers have begun shifting selected services back toward Red Sea/Suez routing, releasing capacity that had been absorbed by Cape diversions.
None of this makes the BIMCO release wrong or alarming. Supply growth outrunning demand growth is a real cycle risk and BIMCO is right to flag it. The operational point is narrower and more immediate: the surplus is not visible yet because inefficiency is eating it, and inefficiency is a worse way to absorb tonnage than idling is, because it is unplanned.
What would have to be true
Recycling has to start. Nearly 2,000 ships totalling more than 5 million TEU are over 20 years old, and fewer than 300,000 TEU went to the beaches in five and a half years. That fleet is the release valve and it is untouched.
Berth windows have to be renegotiated on exchange size rather than call frequency, with crane split and yard density written into the agreement.
Allocation systems have to carry nominal and effective capacity as separate fields, with effective derived from realised round-trip time rather than proforma.
Blank sailing decisions still tend to be announced only a few weeks before the sailing, by which time equipment repositioning and crew plans are often already committed, because equipment repositioning and crew rotation plans are already committed by then.
Phase-in planning has to account for crewing and first dry-dock scheduling on ships entering an already stretched network.
What I would watch
The idle fleet percentage. At 0.6% the market is tight regardless of headline capacity. Sustained movement above 3% is the first honest signal that the surplus has arrived.
Quarterly demolition sales in the 4,000 to 9,000 TEU range. Contracting is easy to track; scrapping is where conviction shows.
Schedule reliability climbing back above 60% while deliveries continue. That would mean the network is absorbing the ships properly rather than hiding them in queues.
The orderbook ratio, reported near 39% of the fleet by Linerlytica, and whether 2027 contracting slows.
Charter rates for 6,000 to 9,000 TEU tonnage. That segment breaks first when the surplus becomes real.